Making market
structure visible.
Options exposure, session replay, and derivatives education in one place.
The problem
An options chain contains a lot of numbers. Seeing how exposure is distributed across strikes and expirations takes more than reading one quote at a time.
Skavinski brings that structure into a visual workspace, with the concepts behind it close at hand.
What I built
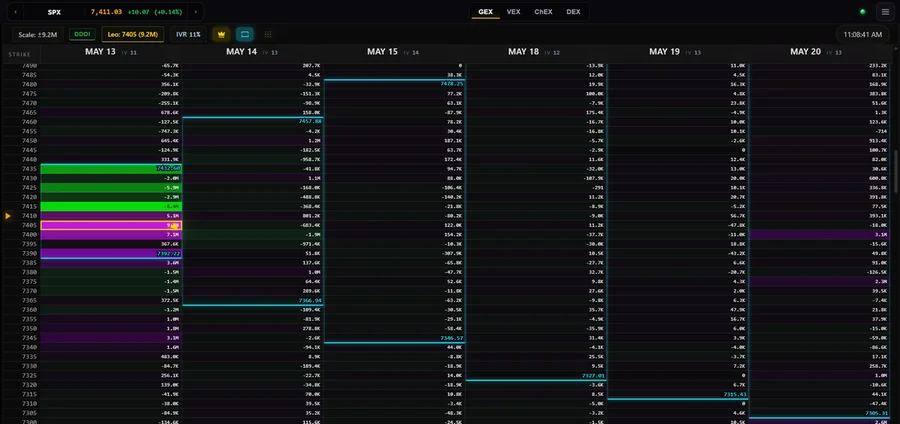
TeploMap puts gamma, vanna, charm, and delta exposure into a shared ladder. TimeWarp supports reviewing a session, while Triglav lets you compare tickers side by side.
The point is to make the distribution visible: where exposure sits, how it changes, and how one view relates to another.
See the platformLearning alongside
the tool
The Academy teaches the same mechanics that appear in the heatmaps. Learn about a Greek, then open its exposure view and inspect it.
That connection between explanation and exploration is a central part of the project.